
KPiQ
For Rocket Fuel Labs, a demand-generation focused marketing agency, there was a clear whole in the market. There's great analytics tools for spending money on ad platforms like Google Ads and Facebook Ads... but there's no great way to connect how much you're spending to how much you're making. Small businesses are inundated with data, but they don’t know how to leverage it to make more money.
None of the SMB clients that Rocket Fuel Labs has ever worked with had a clear way to tie spend to revenue. RFL employees would spend hours every week downloading CSVs from multiple platforms to try and find patterns in data. Our clients spend thousands of dollars every month for us to create excel reports by hand.
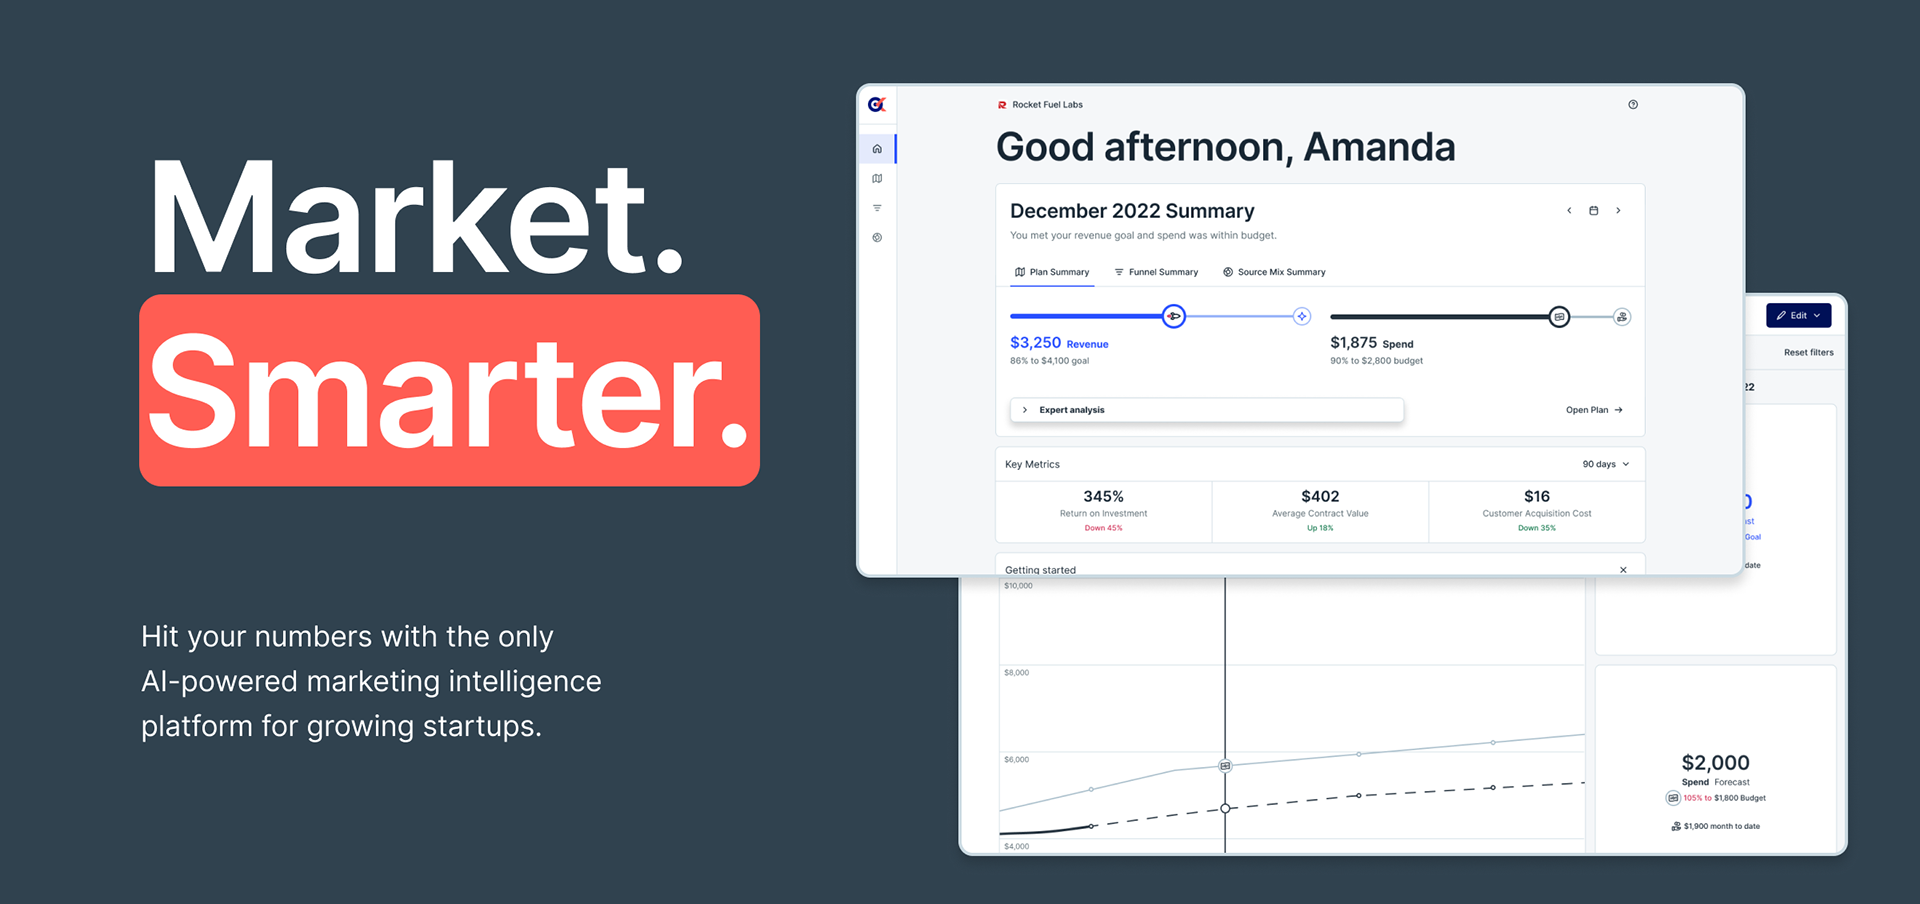
KPiQ is a complete marketing analytics platform connecting budget with revenue data to optimize ROI and maximize revenue volume.
My Role:
As Director of Design, I lead a team of 3 designers and 3 product managers to create KPiQ from the ground up. From user research and design through engineering and launch, we took KPiQ from idea to MVP. I implemented a design sprint methodology and Design System to help the team hit deadlines. The product is in Beta with a $300k ARR waitlist.
The Basics:
Target Audience: Small and medium sized Businesses, including owners and early-stage team members who may not have marketing experience
Problem Statement: In today's fast-paced business environment, companies are inundated with vast amounts of marketing data, making it challenging to derive meaningful insights.
Solution: KPiQ provides a comprehensive solution by automatically organizing and analyzing your marketing data. Leveraging cutting-edge AI technology, KPiQ offers tailored recommendations and insights based on your budget and revenue objectives. The visually appealing and user-friendly interface presents information in a clear and concise manner, ensuring easy comprehension.
The early design process for KPiQ involved using the double diamond method, a well-known design framework. The double diamond method consists of four distinct phases: Discover, Define, Develop, and Deliver.
During the Discover phase, we conducted extensive research to gain a deep understanding of users' needs and pain points. They conducted interviews, user surveys, and market analysis to gather insights and identify opportunities for improvement. This phase was crucial in uncovering the key metrics that matter most to users and understanding their goals and challenges.
In the Define phase, the team synthesized the research findings and identified patterns and themes. They developed user personas and created user journey maps to visualize the user experience. This phase helped the team define the main features and functionalities that would address users' needs and align with their goals.
In the Develop phase, the team started working on the actual design solutions. They generated multiple ideas and concepts, exploring different approaches to visualizing marketing performance, creating customizable funnels, and providing revenue forecasting. The team collaborated closely, iterating on the designs based on feedback from stakeholders and usability testing sessions.
Finally, in the Deliver phase, the team finalized the designs and prepared them for implementation. They created high-fidelity prototypes and conducted user testing to validate the usability and effectiveness of the solutions. The team also worked closely with developers to ensure a smooth transition from design to development.
By following the double diamond method, we created a product that provides users with a comprehensive view of their marketing performance. The features like Home, Funnel, and Plan were carefully designed based on user insights, ensuring that users can easily track their metrics, analyze their marketing efforts, and plan for future success.
The features:
Early Research
After interviewing existing rocket fuel clients and surveying over 200 founders, we discovered that our audience didn't want data-packed spreadsheets or graph-heavy dashboards. They don't want to spend all of their time thinking about marketing strategies and decoding jargon. Instead they want a simple platform with features focused on helping them understand as much information, as quickly as possible.
Unlike other platforms that allow for unlimited customization at the expense of ease of use, we focused answering specific questions with each feature: Will I hit my planned goals this month? Use the plan feature. Why are my leads not becoming customers? Use the funnel feature. How was my performance 6 months ago? Use the performance summaries feature.
Feature 1 -
Performance Home
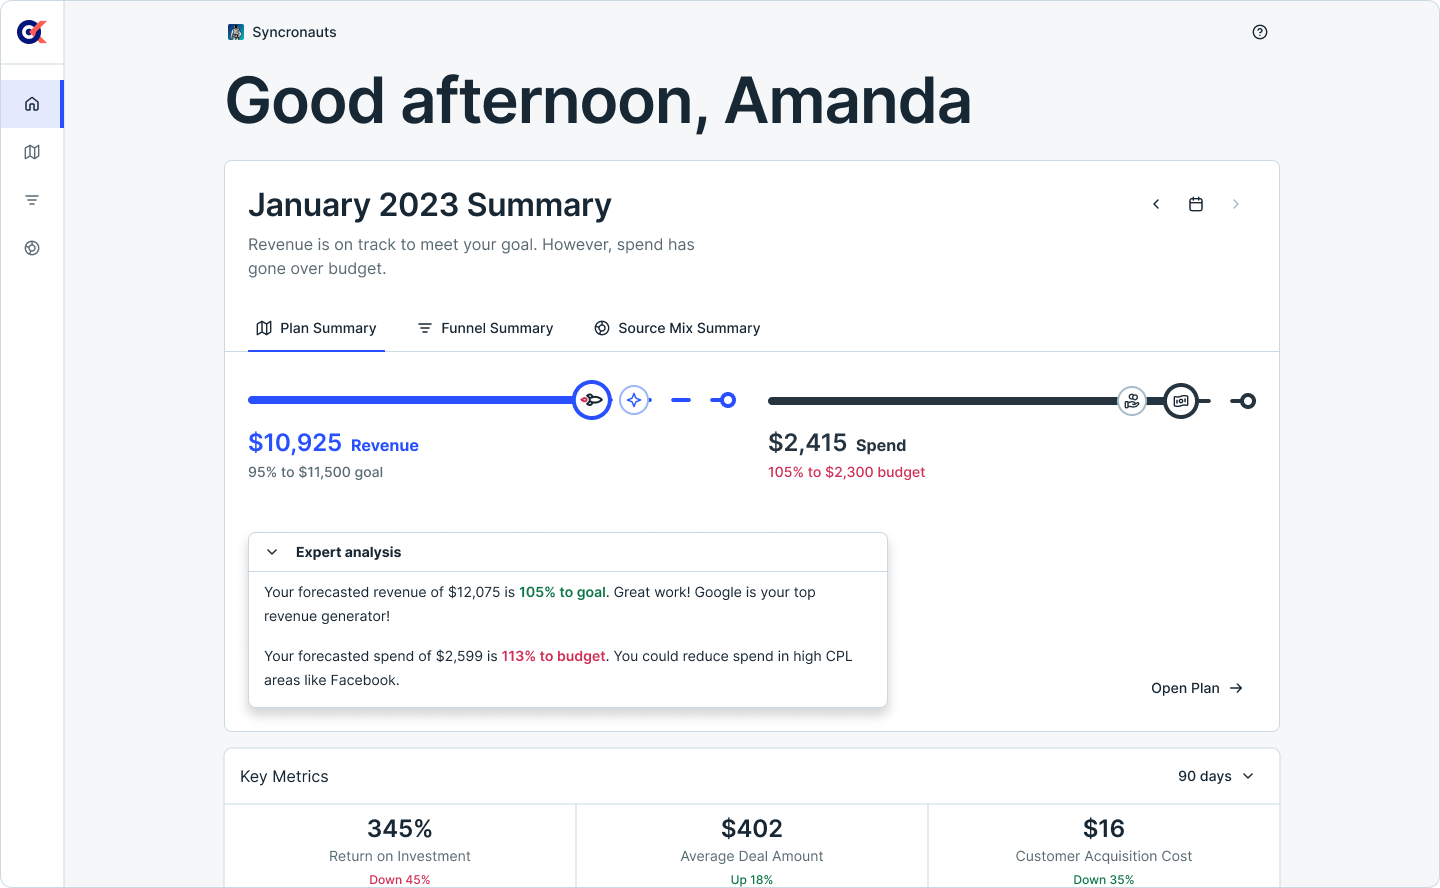
The "Home" feature provides users with a comprehensive overview of their marketing performance, offering key metrics tailored to their specific goals. Serving as a centralized hub, it empowers users to effortlessly monitor their progress and achieve their targets. This feature acts as a digital command center, enabling users to access important insights, event updates, and AI-powered expert analysis, all in one place.
Feature 2 -
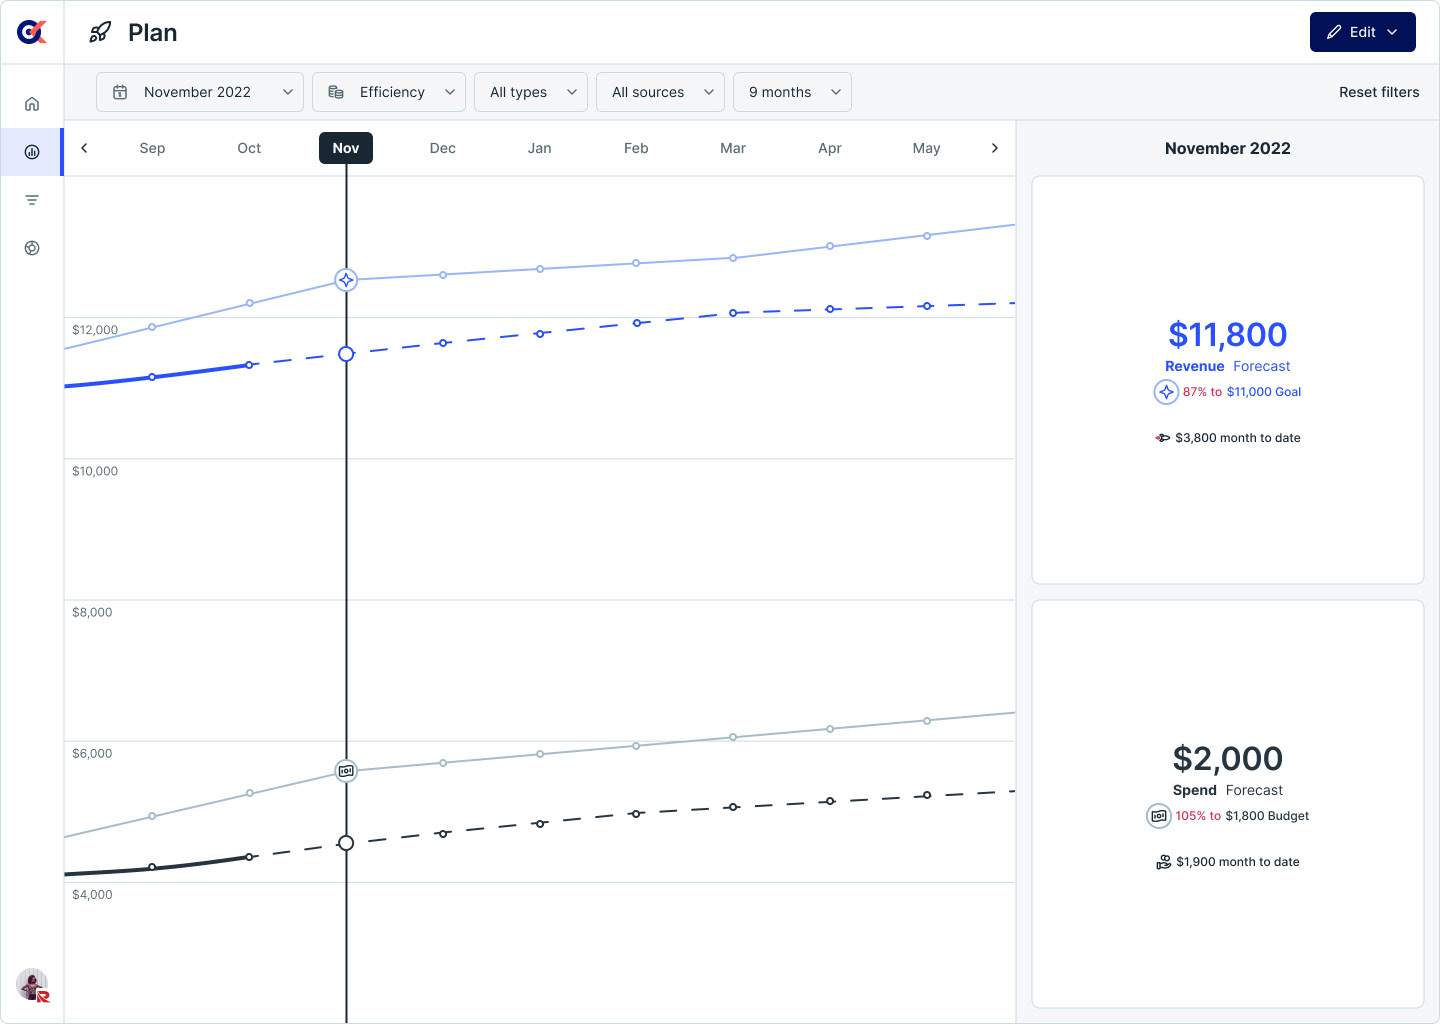
Plan
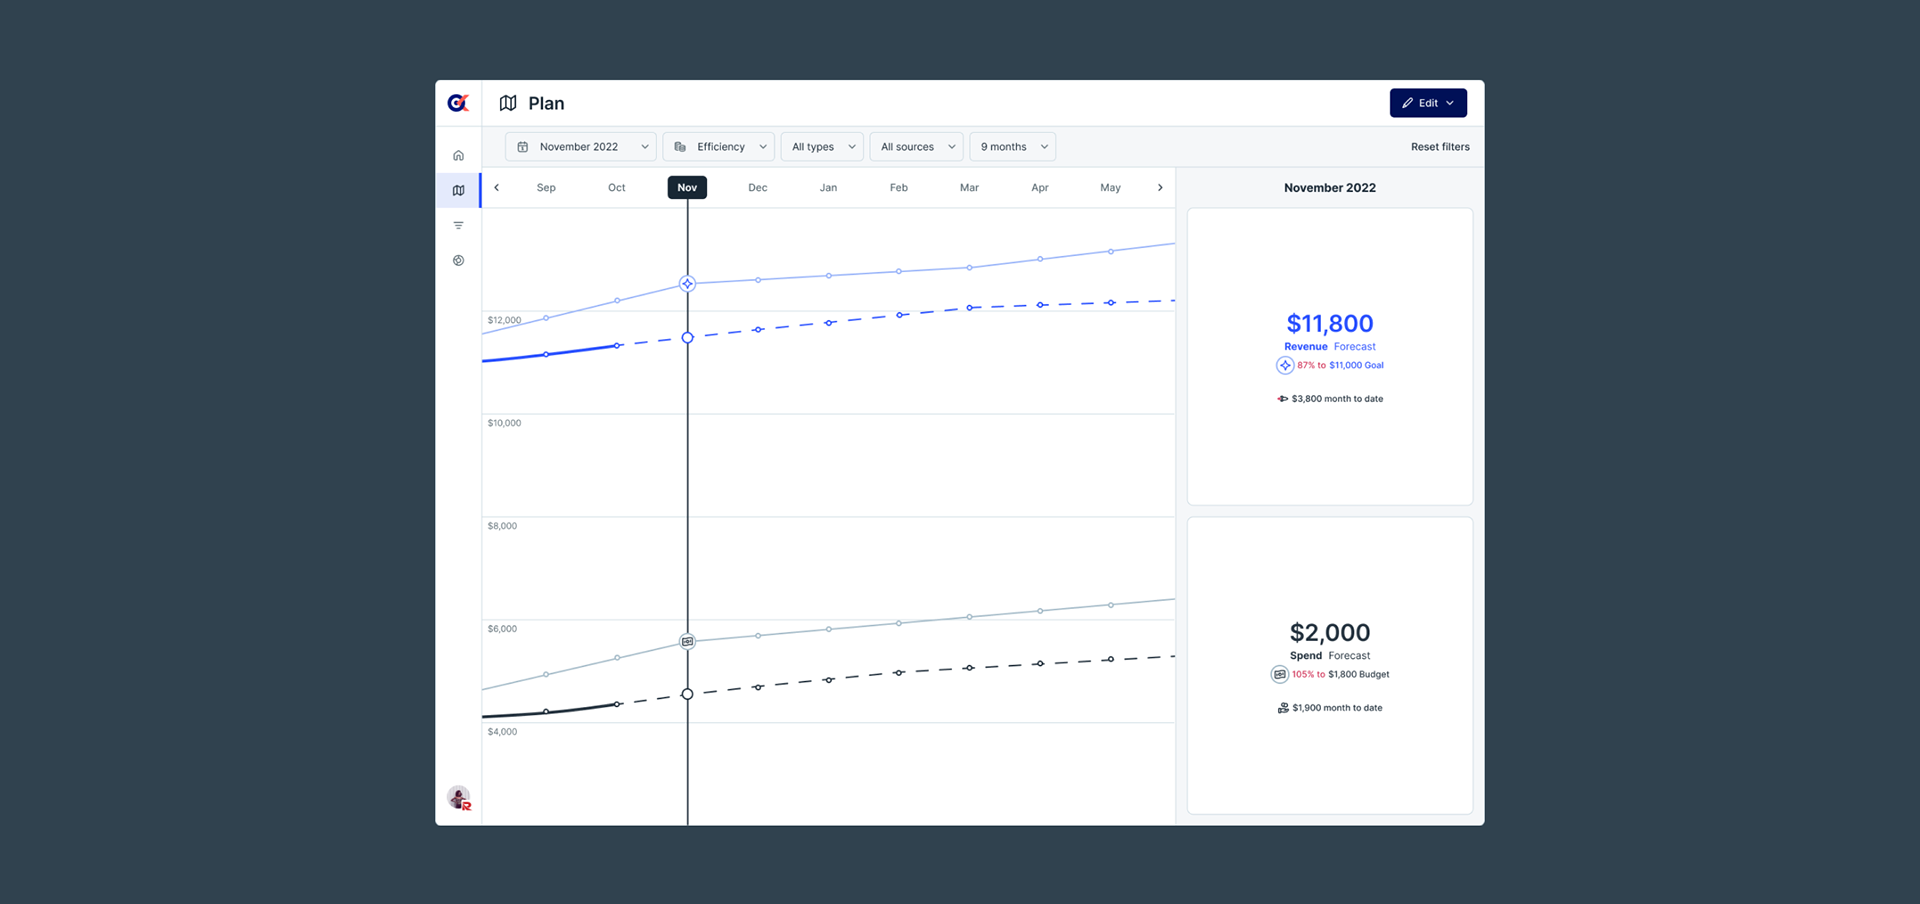
With the "Plan" feature, users are presented with a forecast of their actual revenue and marketing expenditures, juxtaposed against their projected figures based on predefined goals. This invaluable tool equips users with the ability to construct and evaluate marketing plans, leveraging historical data for reference. This design-driven functionality empowers users to align their digital marketing expertise with tangible performance metrics, fostering continuous improvement.
Feature 3 -
Funnel
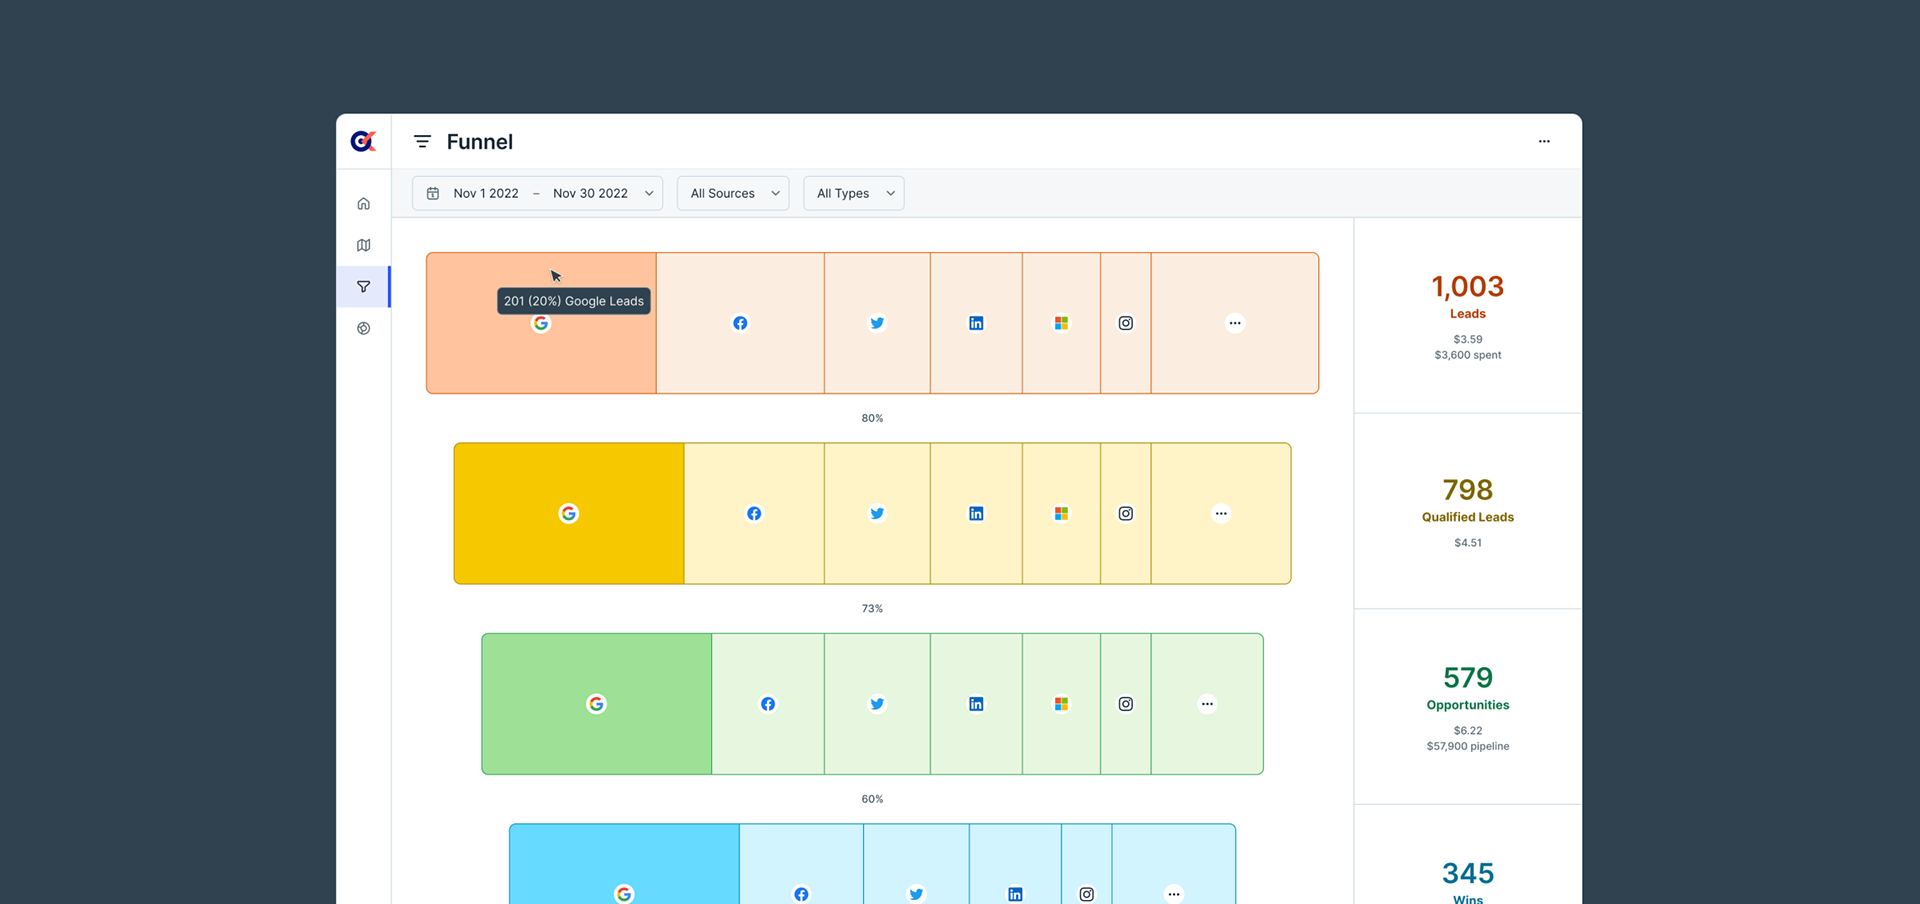
The Funnel serves as a dynamic visualization tool that can be customized to showcase the triumphs and challenges of a user's marketing efforts. By allowing users to navigate through multiple layers of data, while maintaining a holistic perspective, this tool enriches the design process. It facilitates a deep understanding of the overall marketing landscape, aiding in strategic decision-making.

Beta -
Testing and Results
KPiQ launched as an open beta in May 2023. To help us gauge user responses to the new product, we conducted five usability test interviews and received 85 survey results.
67%
of surveyed users planned to sign in to KPiQ to check their performance daily
100%
of users were able to sign up and navigate onboarding
100%
of users could import their marketing data successfully.
of users could navigate the MVP easily.
KPiQ is currently in beta. Learn more about our features at KPiQ.com
More features to be announced